How to connect Visual Studio Code's debugger to Obsidian in MacOS
When developing plugins or themes for Obsidian, debugging can be challenging without proper tools.
This guide demonstrates how to connect Visual Studio Code’s powerful debugger to Obsidian, allowing you to view console logs, set breakpoints, and inspect variables directly from your development environment.
This guide focuses on macOS setup. Windows and Linux users will need to adapt the launch commands for their respective operating systems.
The process
Setting up the Visual Studio Code debugger configuration
Create a file .vscode/launch.json to your VS Code project’s root and copy this to it:
1
2
3
4
5
6
7
8
9
10
11
12
{
	"configurations": [
		{
			"name": "Attach to Obsidian Renderer",
			"port": 9222,
			"request": "attach",
			"type": "chrome",
			"webRoot": "${workspaceFolder}"
		}
	],
	"version": "0.2.0"
}
This configuration tells VS Code to connect to a Chrome debugging protocol on port 9222, which is what Obsidian will expose when we launch it with the right parameters. The webRoot setting ensures that VS Code can correctly map file paths between your project and the running application.
If you’re working on multiple Obsidian plugins simultaneously, you might want to create separate launch configurations for each project with descriptive names.
Launch Obsidian with remote debugging enabled
Launch Obsidian from terminal with these arguments:
1
open -n /Applications/Obsidian.app --args --enable-debug-logging --remote-debugging-port=9222
Here’s what these parameters do:
open -nopens a new instance of the application--enable-debug-loggingincreases the verbosity of console output--remote-debugging-port=9222exposes Chrome DevTools Protocol on port 9222
I am not completely certain whether --enable-debug-logging is required but haven’t tested this without it.
Launching a new instance is particularly useful when you want to keep your regular Obsidian vault separate from your development environment. This way, you can have a dedicated testing vault without risking your main data.
Start the VS Code debugger
Locate the debugger from the Activity bar and click the play button on Attach to Obsidian Renderer. You should immediately see it attaching to Obsidian.
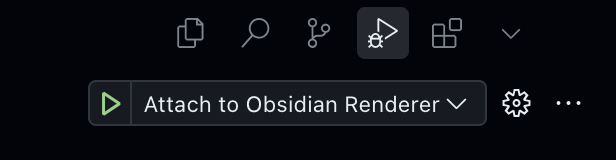
To have the VS Code debugger always visible you can pin it to the Activity Bar from its dropdown menu.
Once connected, you’ll have access to all the standard debugging tools VS Code offers:
- Breakpoints can be set by clicking in the gutter next to line numbers
- The Variables panel shows local and global variables when execution pauses
- The Call Stack panel shows the execution path when paused
- You can use conditional breakpoints and logpoints for more advanced debugging
Observe Debug Console
And voilá! You got all console.logs and traces straight in your VS Code’s Debug Console.
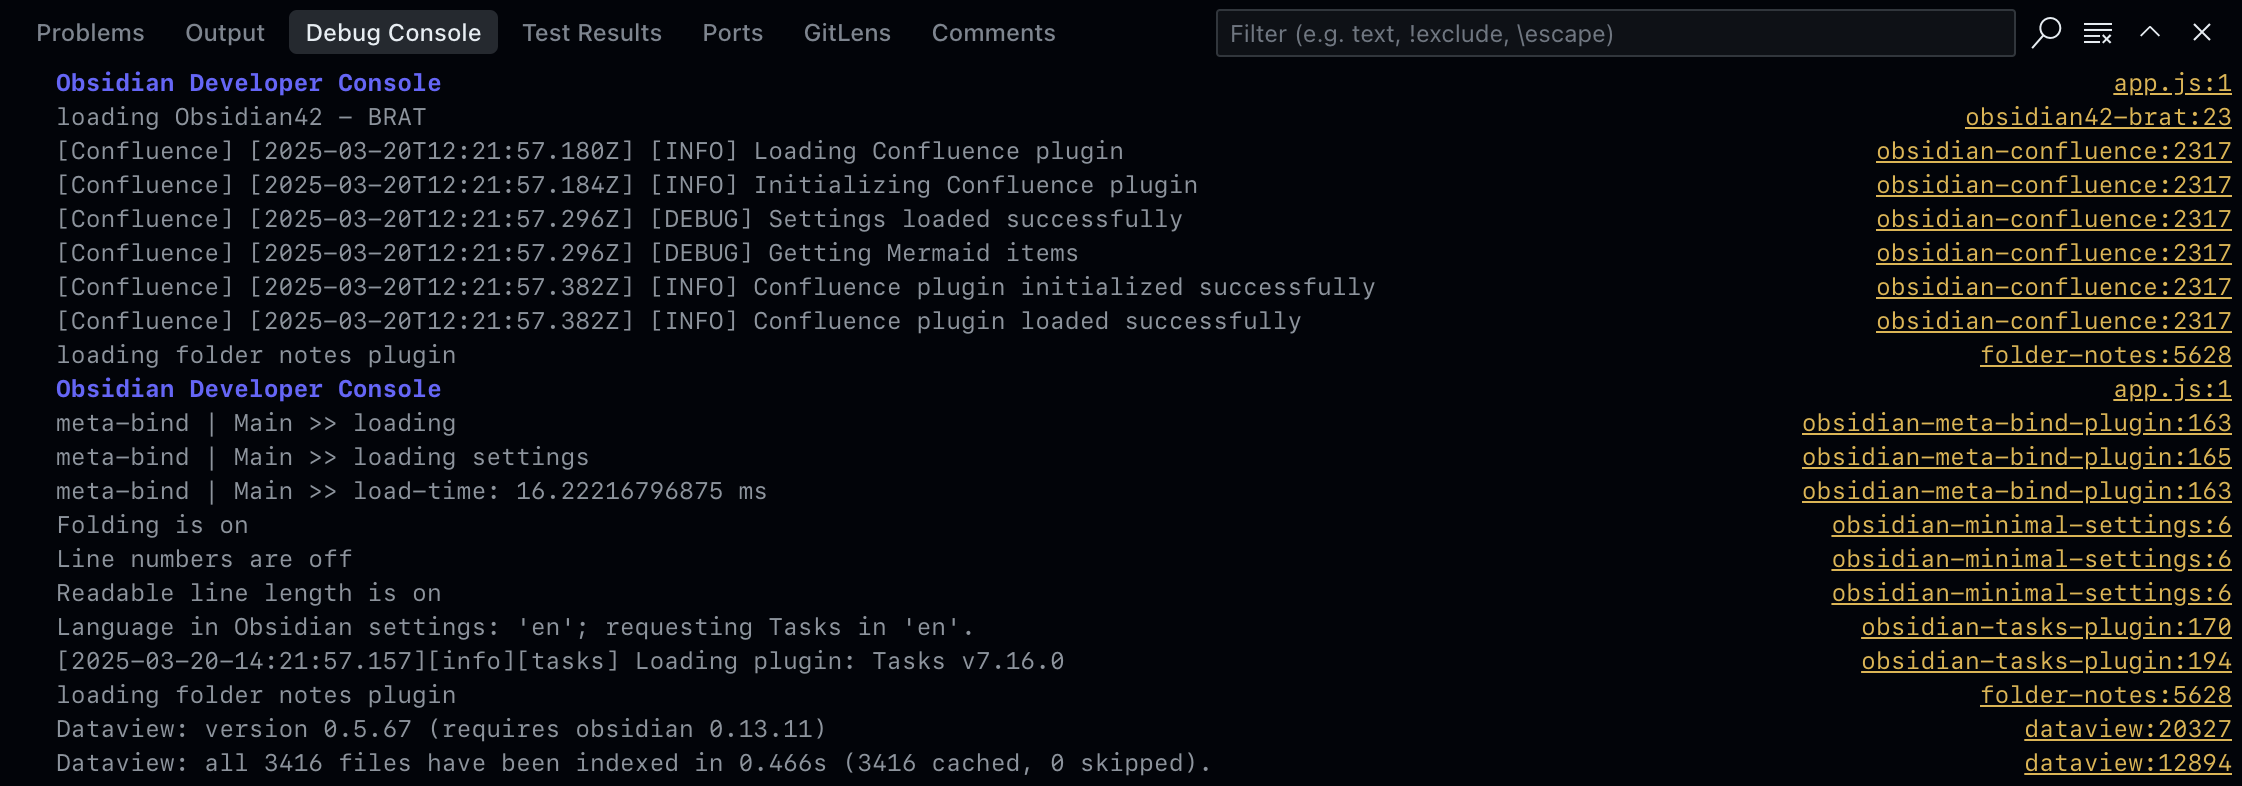
The Debug Console provides several advantages over Obsidian’s built-in developer tools:
- Console output is preserved between debugging sessions
- You can directly execute JavaScript in the context of the running Obsidian instance
- Complex objects are interactive and expandable for detailed inspection
When developing plugins, you can add strategic console.log() statements or use the more structured console.table() for displaying tabular data. The Debug Console preserves ANSI color codes, so you can also use libraries like chalk to make your debug output more readable.
Create a shortcut for launching Obsidian with remote debugging
You don’t need to remember all the Obsidian launch parameters if you create a shortcut. Below you can find instructions for Raycast, Terminal, and Automator
Creating a Raycast shortcut
If you yet haven’t done so, I strongly suggest installing Raycast to your MacOS. It ‘s a multipurpose tool masking as a quick launcher and a Spotlight replacement. It will do wonders to your workflow.
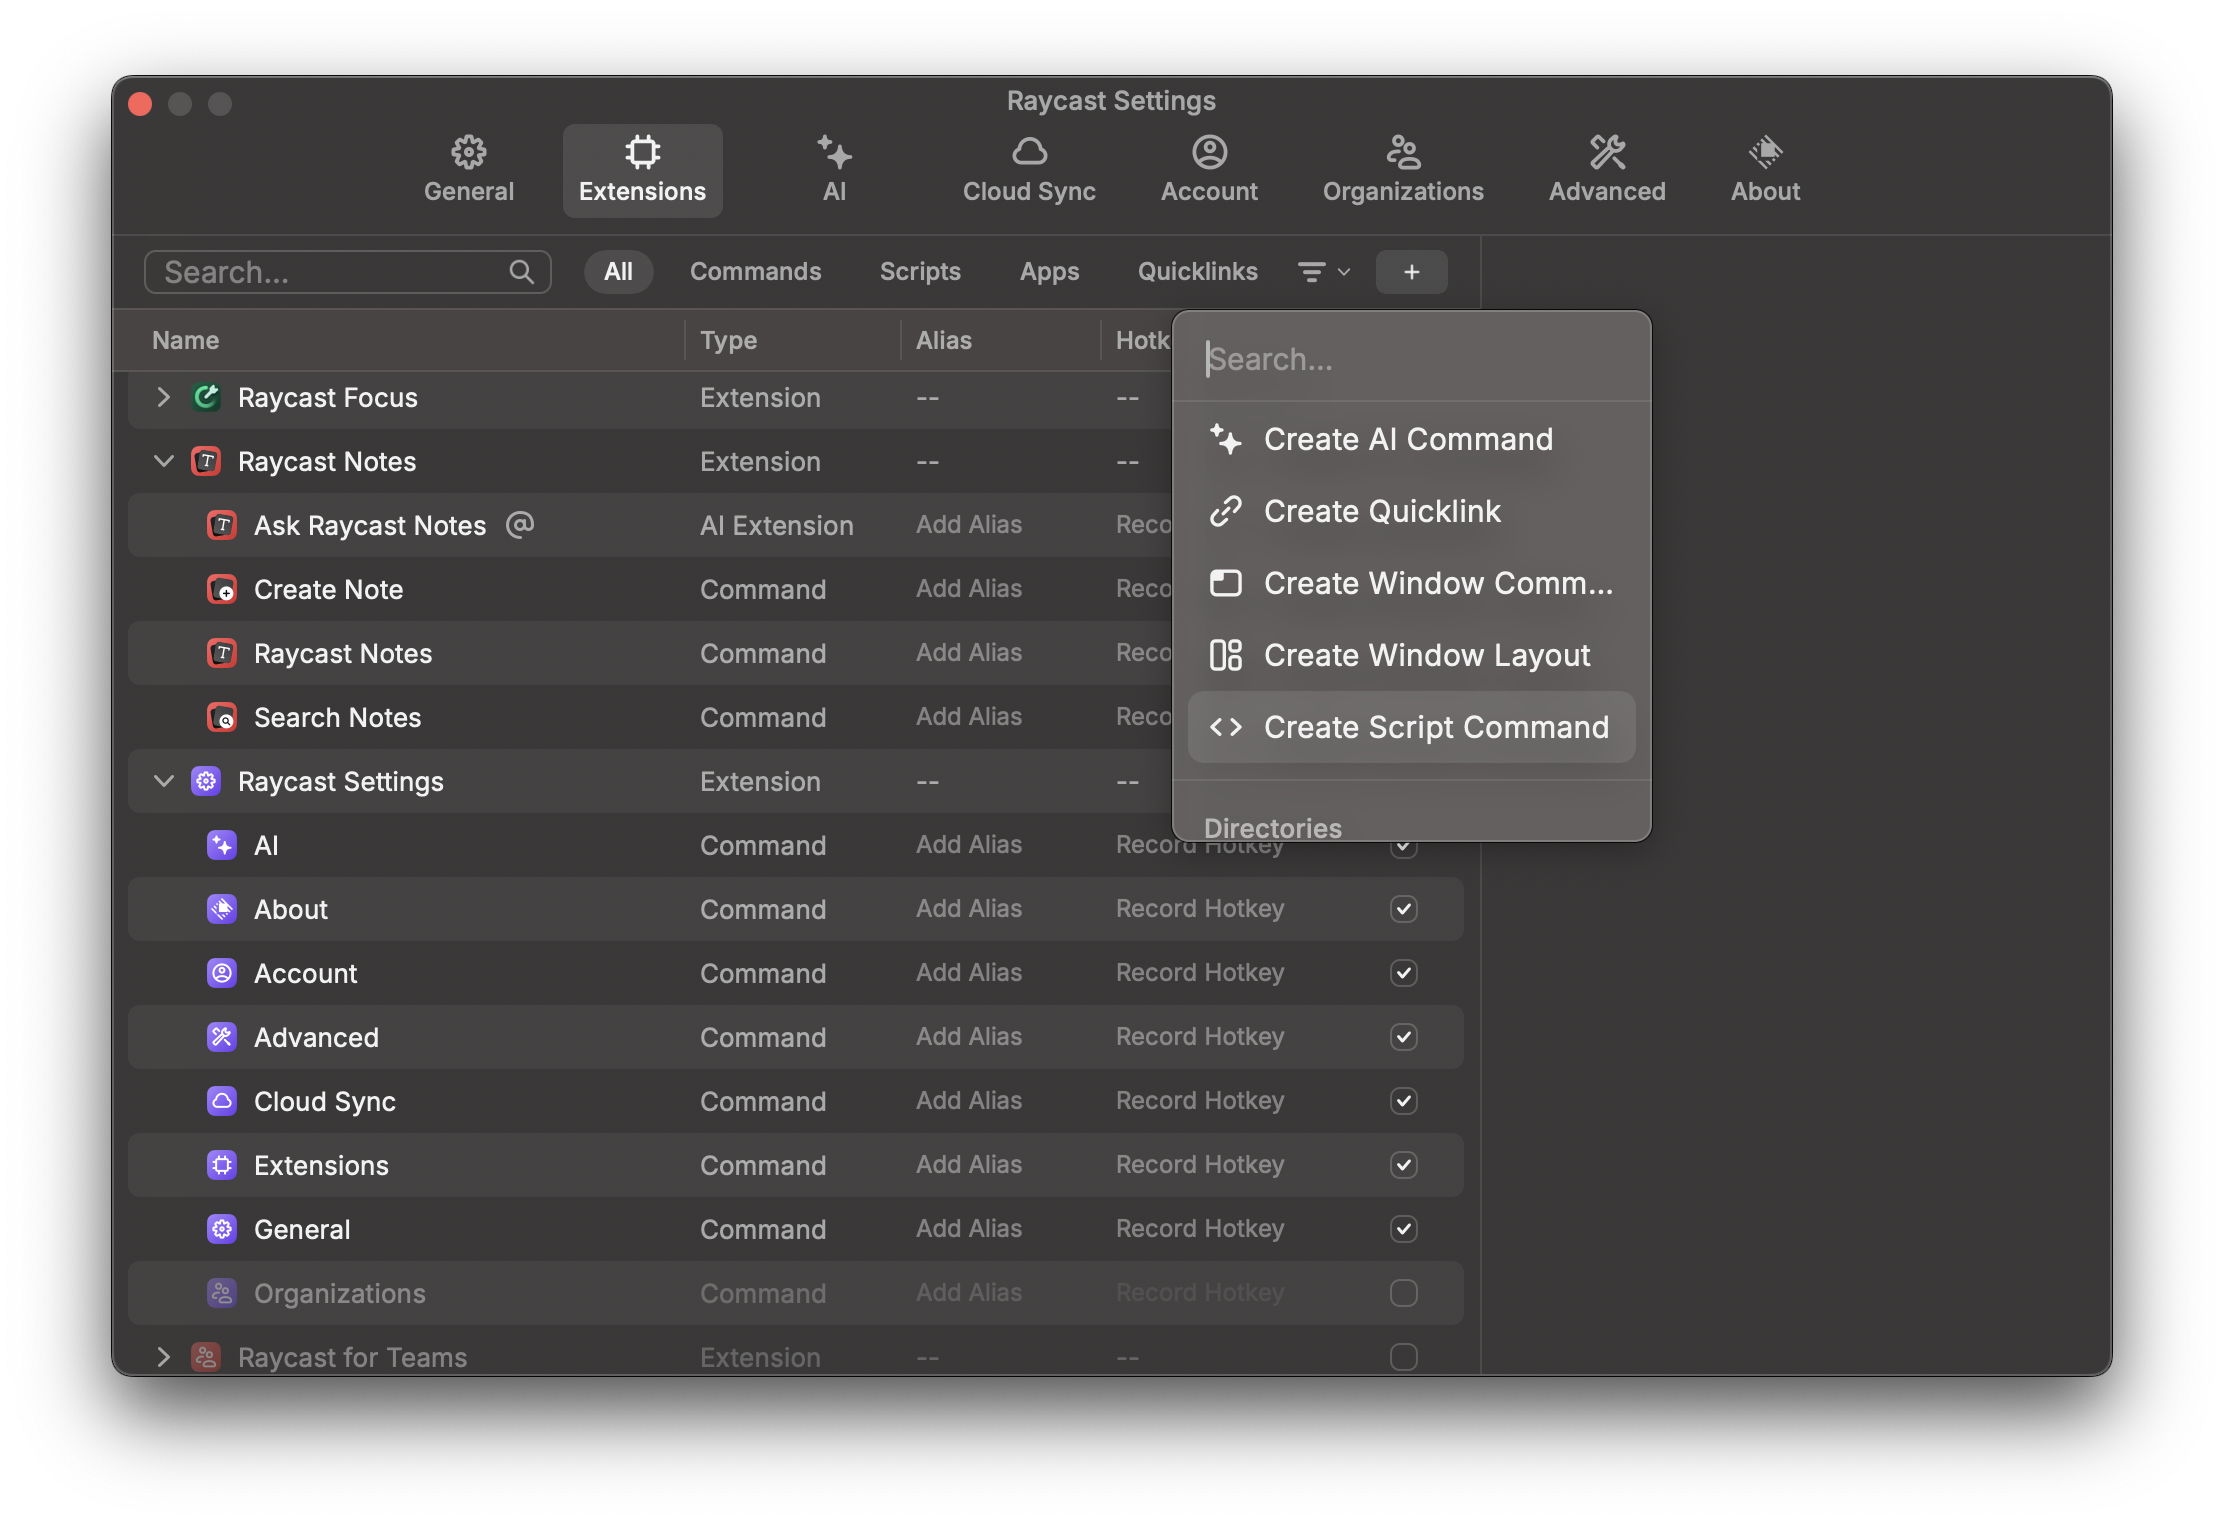
Open Raycast settings with ⌘ + , and under Extensions click the + menu where you find Create Script Command.
Fill in the following details:
- Name: “Debug Obsidian”
- Description: “Launch Obsidian with remote debugging enabled”
- Mode: “Script”
- Language: “Bash”
- Template: “No Template”
In the script editor, paste:
1
2
3
4
5
6
#!/bin/bash

# Launches Obsidian with remote debugging enabled
open -n /Applications/Obsidian.app --args --enable-debug-logging --remote-debugging-port=9222

echo "Obsidian launched with debugging on port 9222"
Save the command, and now you can quickly launch Obsidian in debug mode by invoking Raycast and typing “Debug Obsidian”.
Creating a terminal shortcut
In your Terminal session, run:
1
alias debugobsidian="open -n /Applications/Obsidian.app --args --enable-debug-logging --remote-debugging-port=9222"
Now you can just type debugobsidianto launch it. This alias will only persist for your current terminal session, so if you close your terminal, you’ll need to create it again.
Create a permanent alias
To have the alias available every time you open a new terminal session, you can add the alias to your shell profile. Assuming you’re on a recent MacOS and you haven’t switched away from the default shell (.zshrc), open the Terminal, copy/paste these 8 lines into it, and press enter:
1
2
3
4
5
6
7
8
cat <<'EOF' >> ~/.zshrc
# Launch Obsidian with remote debugger enabled:
# Set the preferred alias name; defaults to "debugobsidian" if not already set
: ${OBS_DEBUG_ALIAS:="debugobsidian"}

# Create the alias using the chosen name
alias "$OBS_DEBUG_ALIAS"="open -n /Applications/Obsidian.app --args --enable-debug-logging --remote-debugging-port=9222"
EOF
Now you have debugobsidian available to you each time you open a new Terminal session.
If you wish to test it in your existing session, source the profile file to activate the alias, and run debugobsidian:
1
2
source ~/.zshrc
debugobsidian
Create a MacOS Automator App
- Open Automator app
- Select New Document → Application
Drag Run Shell Script into the workflow and paste your launch command:
1
open -n /Applications/Obsidian.app --args --enable-debug-logging --remote-debugging-port=9222
- Save as “Debug Obsidian” (or as whatever you prefer) to your Applications folder
- Optional: Give your app a custom icon by:
- Finding the saved app in Finder
- Right-clicking and selecting “Get Info”
- Dragging an image file onto the icon in the top-left of the info window
Now you’ll have a dedicated app you can add to your Dock or launch from Spotlight for quick access to Obsidian in debug mode.
Final words
Setting up the VS Code debugger with Obsidian improves the development workflow when building plugins or themes. This connection gives you direct access to console outputs, breakpoints, and variable inspection in real-time.
This approach eliminates the need to constantly switch between applications and provides more robust debugging capabilities than basic console methods. Whether you’re developing a complex plugin or making simple customizations, having proper debugging tools makes the process more efficient.
If you have questions or suggestions about this setup, feel free to share them in the comments below.